
Live Hurricane Tracking Dashboard for Pensacola
Every storm the National Hurricane Center is tracking in the Atlantic and Gulf, how far each one is from Pensacola, the official forecast cone, and the watches and warnings in effect for Escambia County right now.
Watches & warnings for Pensacola
Issued by the National Weather Service in Mobile, which covers Escambia and Santa Rosa counties.
Loading alerts…
Active tropical cyclones
Sorted by distance from downtown Pensacola. Updated from the NHC every few minutes — reload the page for the newest advisory.
Loading active storms from the National Hurricane Center…
7-day tropical outlook
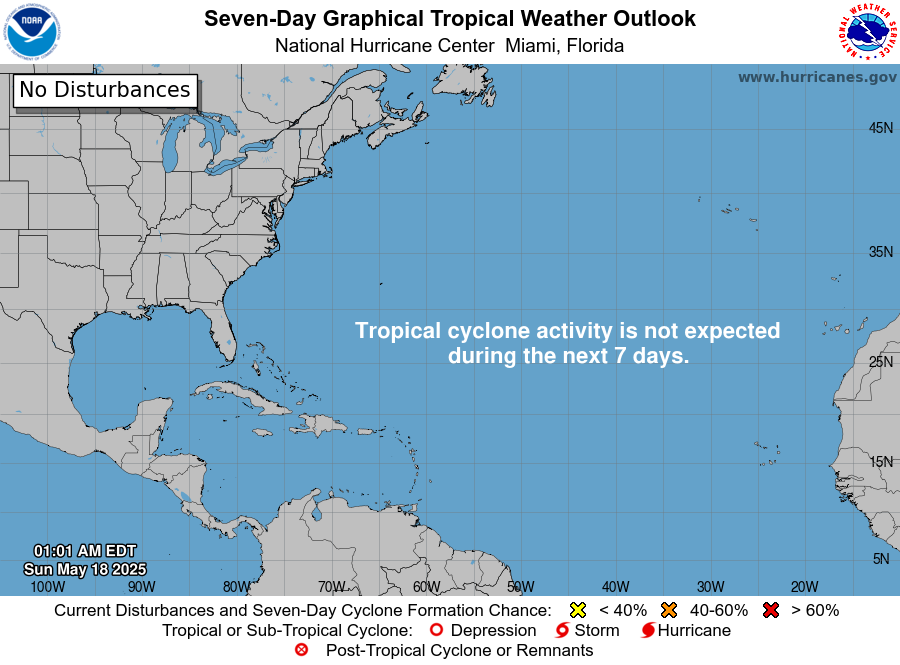
Hatched areas show where the NHC expects possible development. Yellow = low, orange = medium, red = high chance.
2-day tropical outlook
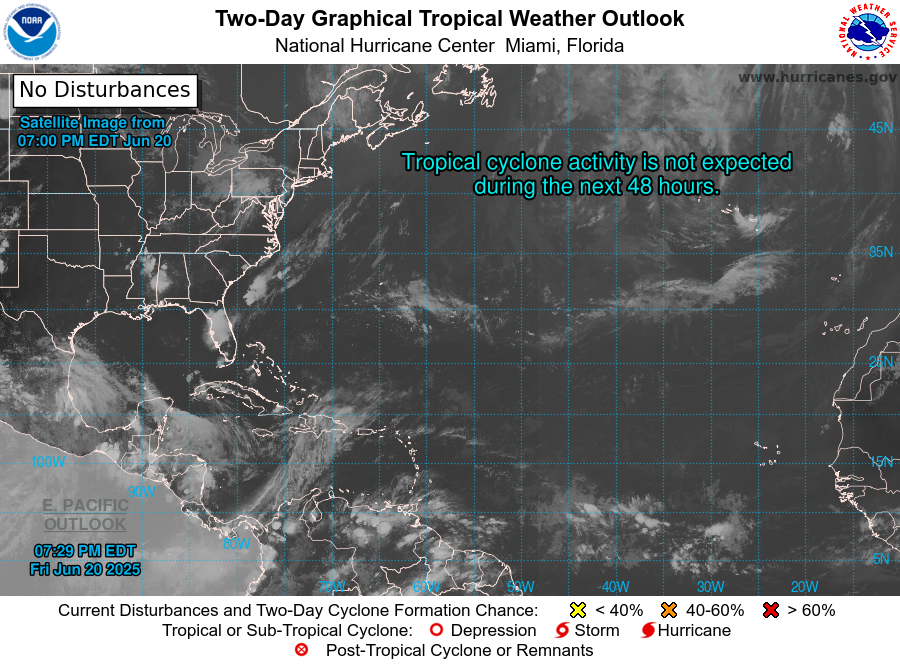
Short-range development chances. A red X near the Gulf is the signal to start preparing.
Interactive wind & storm map
Pan and zoom the live wind field over the Gulf. Switch layers (rain, pressure, waves) inside the map.
How to read a hurricane forecast for Pensacola
The cone is about the center, not the impacts
The NHC forecast cone shows where the center of the storm is likely to go — historically, the center stays inside the cone about two-thirds of the time. Hurricane-force winds, surge and rain routinely extend well outside it. Hurricane Ivan's center came ashore near Gulf Shores, Alabama, about 30 miles west of Pensacola, yet the worst surge in Escambia County history followed because Pensacola sat in the storm's right-front quadrant.
The right side of the storm matters most
In the Northern Hemisphere, winds circle counter-clockwise, so the strongest winds and highest surge are usually on the right side of the track (east of the center for a northbound storm). A landfall anywhere from Mississippi to Alabama puts Pensacola on that dangerous side.
Watches, warnings and timing
| Product | What it means | Typical lead time |
|---|---|---|
| Tropical Storm Watch | Sustained winds of 39–73 mph possible | ~48 hours |
| Tropical Storm Warning | Sustained winds of 39–73 mph expected | ~36 hours |
| Hurricane Watch | Sustained winds of 74 mph or more possible | ~48 hours |
| Hurricane Warning | Sustained winds of 74 mph or more expected | ~36 hours |
| Storm Surge Warning | Life-threatening inundation from rising water expected | ~36 hours |
| Extreme Wind Warning | Winds of 115 mph or more imminent — take shelter in an interior room | Minutes to an hour |
Saffir-Simpson scale
| Category | Sustained wind | Pensacola example |
|---|---|---|
| 1 | 74–95 mph | Danny stalled over Mobile Bay with flooding rain (1997) |
| 2 | 96–110 mph | Erin near Navarre Beach (1995); Sally near Gulf Shores (2020) |
| 3 | 111–129 mph | Ivan (2004), Dennis (2005), Opal (1995) |
| 4 | 130–156 mph | Ivan crossed the Gulf as a Category 4 before weakening |
| 5 | 157+ mph | Michael hit Mexico Beach, about 130 miles east, in 2018 |
The category only describes wind. Sally was “only” a Category 2, but its slow motion made it one of the costliest storms in Pensacola history because of rain and surge. Read more in our storm surge and flood risk center.